Track customer progress with the new report history feature
Sharlotte Briscoe • September 23, 2022
We all love to save time, and have our workload made easier and more convenient, so we’ve created a way to do this, with the new layout on our report history feature.
We’ve recently updated the look of our report history and what data features on it, so you’re able to pull up all of the historic changes and activity all in one go! It’s a perfect snapshot of the changes and progress that have been made with a customer’s website, it also gives you details on what your team members have been up to in the account. So let’s take a look at this good stuff in more detail!
Where can I find the report history feature?
Fab question, when you’re viewing a report, you’ll see a little clock icon with an arrow on it towards the top right, click on that and you’re in!
What’s on there and why will it help me?
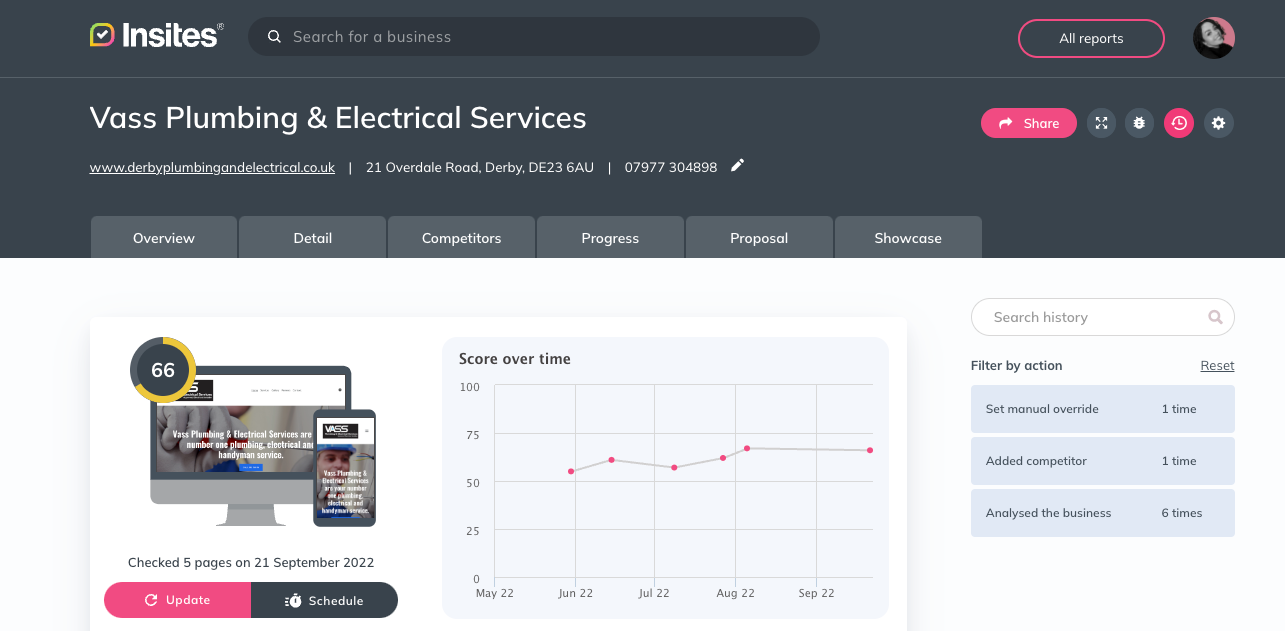
First up we’ve got the top section, which contains the snapshot of the website, the current overall report score (which we’ll go into a little more later on in this article) and the score timeline.
Keeping track of the value you’re providing your customers is essential and it’s handy to be able to see it all laid out – so here it is! On the right is a clear display of all the scores, that a particular website has achieved historically laid out nicely in a graph, so you can see the progress that has been made with that website’s score over time, ensure you’re providing value and reevaluate your growth plan with that customer if needed.
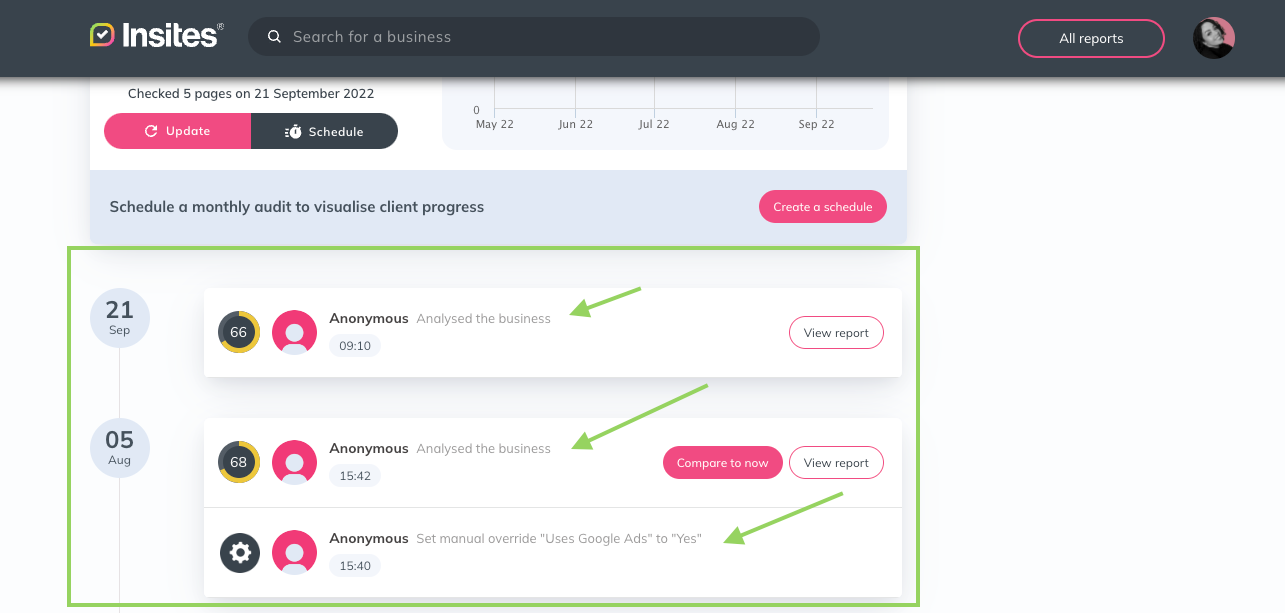
A little further down you’ll see a list of actions carried out on the report – Each time a team member changes something, runs a report, shares a report etc this will show in a list below the graph. This also tells you which team member has actioned it, what they did and when they did it.
Searching for a specific action on the account? You can easily find it with the filtration feature to the right. You may have lots of information and actions within the report history, so you can filter the actions by the user and the type of action performed.
So, I can see the timeline of the score, but what does the score mean?
What we call the overall score is a weighted average of all of the tests enabled in the account, and gives you a clear representation of how well a website’s digital health is doing in lot’s of different aspect of an online presence.
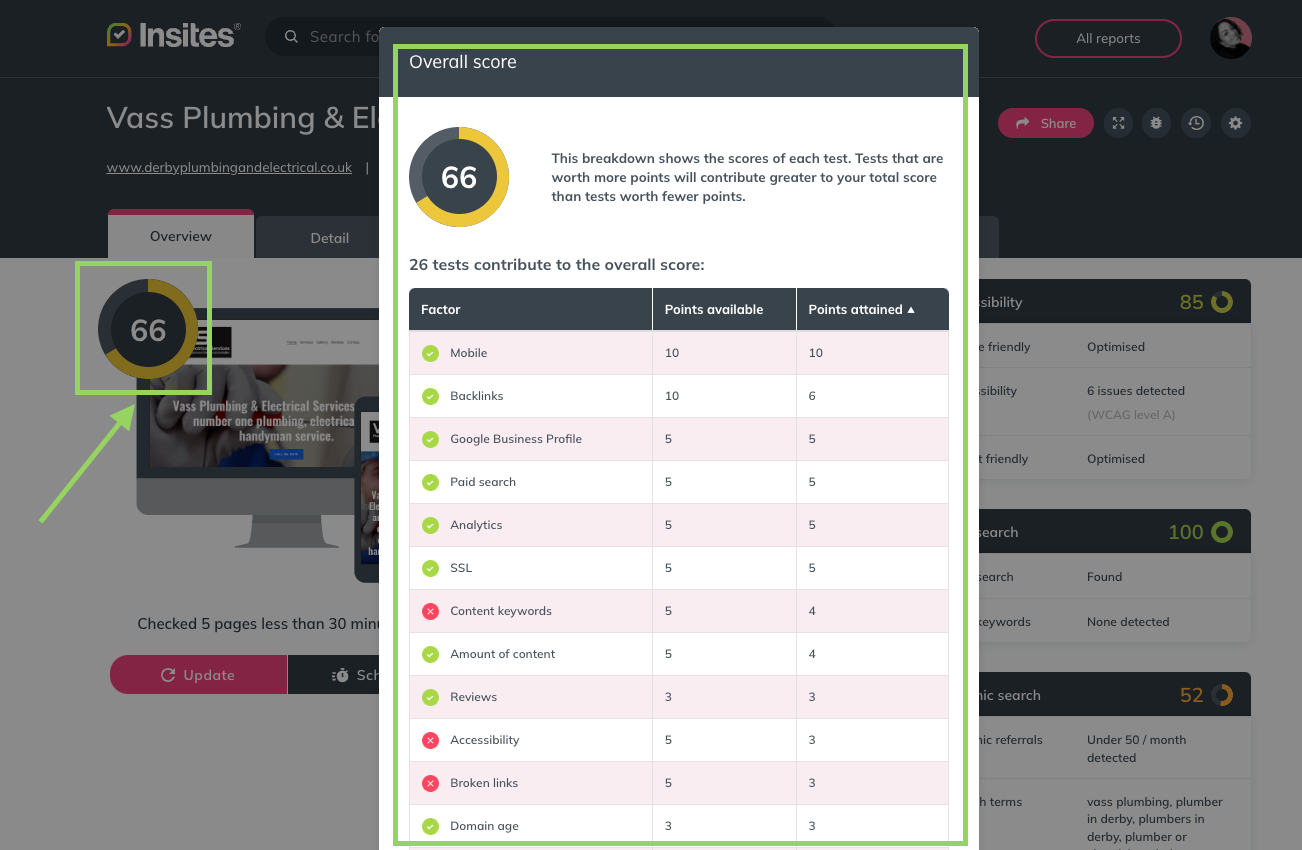
If you click on the overall score when you’re viewing the overview page, it will give you a table that breaks down the score, how many points are available for each test and how many points have been achieved.
The table gives you a side by side visual of how the customer has scored for a test vs how they ‘could’ score for that test. A great opening to discuss or potentially upsell a product that will help the customer increase that score and have their digital health score improve. Providing proof of this with the overall score history.
If you’d like any more information on the report history feature, or if you’d like some support with increasing your usage and utilising your account please contact your account manager and they’d be more than happy to arrange some time to help.
Thanks for reading!


